A Quick Glance

  • black-arrow

    Learn How to enhanced format your charts, and graphs like professionals work

  • black-arrow

    Find out how to deal with difficult trends in charts and graphs

  • black-arrow

    Find out how to make use of a bar chart and a pie chart to highlight the differences in a data set

  • black-arrow

    Learn the tools and options for exporting your charts and graphs

  • black-arrow

    Learn the limitations of pie charts and the top way to correct them

  • black-arrow

    Study how to use Pivot Tables and Pivot Charts

  • black-arrow

    Study how to put together graphics into your spreadsheets

Microsoft Excel 2016 Advanced training course, follows up from the MS Excel 2016 Intermediate course by delving even deeper into the features and functions of this powerful spreadsheet software. MS Excel 2016 is much more than a rapid way to add up numbers. In this course, Delegates will be trained on advanced features such as nesting IF statements, how to calculate the Mean of a group of numbers using SUMIF, AVERAGEIF, and more.

Delegates will learn about working on lookups with functions such as HLOOKUP and VLOOKUP. This training course will teach delegates about Sparklines, Pivot Tables and Charts. In the end, delegates will learn how to create and record your Macros. At the completion of this Advanced Training for MS Excel 2016, Delegates will have expertise in the advanced features and functions of this software.

Who should take this course

  • A must for every expert from entry to senior level managers in any business
  • Engineering & IT graduates
  • Management graduates
  • For Delegates looking for entry level jobs in any domain, this is compulsory
More

Prerequisites

Delegates should be aware of fundamentals of MS Excel.

More

What Will You Learn

  • Master MS Excel Functions and Formulas that saves time and increases productivity
  • Reduce hours of Hard-work by using Pivot tables while doing analysis data
  • Find out new tools to share your work
  • Find new and more efficient ways to analyse data
  • Add colour and images to improve readability and get messages across to the audience more effectively
  • Find out the tricks to create professional charts and graphs
  • Consist of diagrams in marketing reports and sales presentations to boost up sales and readability
  • Find new ways to visualise data
  • Trim down monthly workload by automating cyclic tasks by using macros
  • Importing data with the help of Power Pivot
More

  Course Overview

Microsoft has put add-on very powerful tools to Excel over the previous version of the MS Excel. Know about tools will save your time and energy combing through information. Learn how to create extraordinary charts and graphs (formatting gridlines, presenting basic trends, complex trends, even trends over time). Learn the differences between the variety of types of charts, relationships in data, and ways to demonstrate differences.

Learn different methods to build your exceptions stand out so you can attack the anomalies and make use data effectively to make operations better. MS Excel’s tools are enclosed in depth which includes discussions on setting up live charts, Sparklines, color scales, and icon sets.


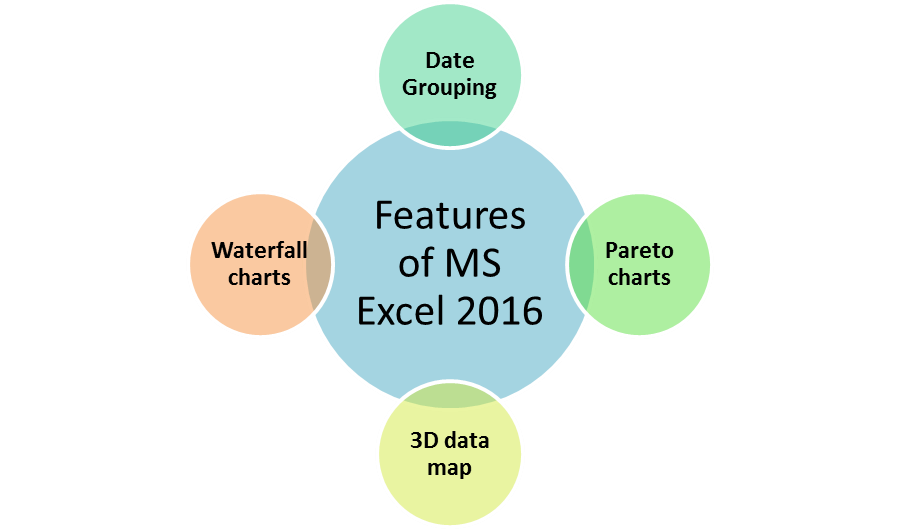
features of MS Excel 2016

More

  Course Content

Basic Steps for Charts & Graphs

  • Overview to Advanced MS Excel 2016
  • Vital Information for a Successful Training Experience
  • Steps to Create Graphs and Charts
  • Additional Features to Help Create Charts and Graphs
  • MS Excel 2016 keyboard shortcuts

Layout Tab:

  • Detail Formatting for Charts and Graphs
  • Formatting Legends within Charts and Graphs
  • Formatting Axes and Gridlines within Charts and Graphs

Trends

  • Trends of Charts and Graphs
  • Complex Trends of Charts and Graphs
  • Trends over Time of Charts and Graphs

Differences

  • Show Differences using Bar Charts
  • Show Differences by using Pie Charts
  • Restrictions with Pie Charts & How to Correct
  • Substitute Ways to Show Differences

Relationships:

  • Using Charts and Graphs to Show Relationships

Stock:

  • Charting & Graphing Financial Information
  • Specific Charts for Finance Information
  • Setting Up Live Charts

The MS Excel IF Function

  • Syntax of IF
  • Nesting The IF Statement In Excel
  • Use AND Operator To Reduce the number Of Nested IF’s
  • Use OR Operator To Reduce the number Of Nested IF’s
  • The NOT Operator within AND and OR Statements
  • SUMIF for Selective Adding Up
  • COUNTIF for Selective Counting
  • AVERAGEIF for The Mean Of Cells That Meet Our Criteria
  • Multiple Criteria of The Same SUM, AVERAGE And COUNT Functions

Performing Lookup in Excel

  • VLOOKUP
  • Examples for VLOOKUP
  • HLOOKUP
  • HLOOKUP In Action
  • Look For A Near Match In A Lookup
  • Check Missing Data In A Lookup
  • Extend The Size Of A Lookup Table
  • Nested LOOKUPs In Excel

Excel Data Functions

  • The MATCH Function
  • The INDEX Function Syntax
  • How To Stop Non-existent Row or Column Lookups In INDEX
  • The CHOOSE Lookup Function

Excel Math Functions

  • Handling TIME
  • Rounding To Fractional Values
  • MOD For Working Out Remainders
  • Generate A Random Number
  • Select up List Item at Random
  • Calculation of a Loan Repayments Using PMT
  • Excel - Investment Calculations Using PMT
  • Study Depreciation
  • Learn how to Different Parts Of A Loan Calculation

Arrays In Excel

  • Overview of an Array and Array Formula
  • Create And use an Array Formula
  • Conditional Evaluation in an Array Formula
  • TRANSPOSE Array Function

Sparklines

  • Create A Sparkline In Excel
  • Change The Design Of Sparklines
  • Deal with Empty Cells
  • Compare One Sparkline To Another by Altering Vertical Scale
  • Remove Sparklines from a Sheet


Worksheet and Workbook Protection

  • Understanding Protection
  • Encrypting Files with Passwords
  • Allowing Specific Worksheet Changes
  • Adding Protection to Selected Cells
  • Additional Protection Features

Advanced Formatting

  • Enhancing Worksheets with the use of Themes
  • Work with the Comments
  • Create users AutoFill List
  • Turn your data into the table for formatting


Automate processes with Macros

  • Macros
  • Display the Developer Tab
  • Create a Basic Formatting Macro
  • Run a Macro
  • Assign a Macro to a Button
  • Create Complex Macros
  • View and Editing the VBA Code
  • Add a Macro to the Quick Access Toolbar

Form Controls

  • What are Form Controls?
  • Adding Spin Buttons and Check Boxes
  • Adding a Combo Box
More

Shortcuts of Excel

Shortcuts for the MS Excel:

To do this

Press

Close a spreadsheet

Ctrl+W

Open a spreadsheet

Ctrl+O

Go to the Home tab

Alt+H

Save a spreadsheet

Ctrl+S

Copy

Ctrl+C

Paste

Ctrl+V

Undo

Ctrl+Z

Remove cell contents

Delete key

Choose a fill color

Alt+H, H

Cut

Ctrl+X

Go to Insert tab

Alt+N

Bold

Ctrl+B

Center align cell contents

Alt+H, A, then C

Go to Page Layout tab

Alt+P

Go to Data tab

Alt+A

Go to View tab

Alt+W

Format a cell from context menu

Shift+F10, or

Context key

Add borders

Alt+H, B

Delete column

Alt+H, D, then C

Go to Formula tab

Alt+M


Vlookup(): It helps to search a value in a table and returns a corresponding value.


Syntax: = LOOKUP( value, lookup_range, [result_range] )


HLOOKUP(): The MS Excel HLOOKUP function performs a search for a value in the top row of the table and returns the value in the same column by index_number.


HLOOKUP( value, table, index_number, [approximate_match] )


Microsoft Excel 2016 Advanced Enquiry


Enquire Now


----- OR -------

Reach us at +44 1344 961530 or info@pentagonit.co.uk for more information.

About Milton Keynes

Milton Keynes

Milton Keynes also abbreviated as MK is a large town located in Buckinghamshire, England. It was designed as a new town on 23 January 1967 and also an administrative centre of Borough of Milton Keynes. It is located 45 miles that is 72 km away from north-west of London.

Various another town like Bletchley, Wolverton and Stony Stratford exist here along with other 15 villages and farmland. Milton Keynes took its name from existing “Village of Milton Keynes “that is few miles away from the planned centre.

History of Milton Keynes

Milton Keynes has a rich history with proof of human settlement that was found before starting the construction of this city in 1960’s. When UK government decided to establish Milton Keynes, most of the area was farmland, and undeveloped villages and the earlier history was incredibly rich. Until the 10th century, there was no evidence of occupation in villages. During middle age, 18 villages were present that still form the heart of Milton Keynes districts. With the arrival of London and Birmingham Railway and Grand Junction canal in late 18th and 19th century, the area went through many changes and the new town of Wolverton, and New Bradwell emerged.

The greatest change in the history of Milton Keynes was when it was chosen to solve housing problems in London. Milton Keynes was planned as biggest towns and have an area of 89 square kilometres that became home to around 250,000 people. In the beginning, no building was allowed to be tall than the tallest tree, and later Milton Keynes Partnership changed it. Tallest building in Milton Keynes is 14 floors high. Its population will double by the year 2026.

Milton Keynes offers a broad range of opportunities to people to learn new things and get a better education. Bletchley Park code breakers brought innovation to the city in second world war. This team cracked secret codes of Germans. Milton Keynes is a destination that is always passionate about developing minds. It contains some of the best schools and colleges. Milton Keynes College offers a wide range of courses in different domains. It is one of the fastest growing college in the United Kingdom.

Open University offers contemporary learning where degree level education is provided to everyone. The headquarters of the university is located at Walton Hall in Milton Keynes. There is also University Centre Milton Keynes ( UCMK) which is a hub for higher education with new facilities and exciting courses in the middle of the city. This town also contains a solar-powered house that plays a significant role in the development of electric transport. Various courses, classes and opportunities are offered by Milton Keynes Theatre Creative Learning department to young people and adults to explore theatres including makeup, drama, acting and much more.

Sport

Milton Keynes has various professional teams in football, in ice hockey and in Formula one. It is also home to Xscape indoor ski slope, Formula Fast Indoor Karting Centre, Airkix Indoor Sky Diving facility and National Badminton Centre.

Economy

At Borough level, data of Milton Keynes economy, demography and politics is collected. Milton Keynes is one of the most successful economies in Southeast along with gross value added per capita index which was 47% higher than the national average. According to 2015 data, average wages place it in top five nationally.

Just 0.6% of businesses employ people more than 250 which include Open University, Volkswagen Group, Mercedes-Benz and Network Rail. Remaining enterprises around 81.5% employ near about 10 people. Milton Keynes professional, technical and scientific sector contributes large employment. Milton Keynes has a high number of business start-ups in England and start-up levels remained high even during the period of recession 2009/2010. Most of the population is younger. 22.6% of Borough population is under 16, 12.1% are aged 65+. According to 2011 census report, Milton Keynes Urban area comprises of 8.7% South Asian, 78.4% white, 3.5% Mixed Race, 7-5% Black, 1.2% Chinese, 6.7% other ethnic group and Asian.

More